
I hope you all had a well-earned and very Happy Easter break!
Money is no longer ‘free’ or at least as near to free as it has been in the past few years. Money is now more expensive, primarily because of the significant burst of inflation and the quickly rising interest rates response by central banks to combatting this burst. The world is still realigning, readjusting, and rebalancing from those strange few years since early 2020.
Families, businesses, and governments have felt the challenges of these years with each of these sections, i.e., all of us, absorbing a lot of pain in the process and for much of this duration. However, life continues onwards, and it is really just another part of history to try and understand, and to learn from it all, including certain mistakes but with the benefit of hindsight. It reinforces that you take nothing for granted in life. By historical measures, it also emphasises the need of keeping with ‘the plan’ and not being diverted by short term events and hurdles.
With the Reserve Bank of Australia (RBA) pausing its run-on official interest rate increases this month, there is a strong sign that the rising discomfort of the rate rises in the system is dousing the prevailing inflationary pressures that we all have felt with shortages of goods and services, and with the persistent expensive prices we are all paying for those we can get!
I think it was an intelligent move by the RBA to take this ‘rate rise pause’. As Philip Lowe, the Governor of the RBA, stated last week, “The Board recognises that monetary policy operates with a lag and that the full effect of this substantial increase in interest rates is yet to be felt. The Board took the decision to hold interest rates steady this month (April) to provide additional time to assess the impact of the increase in interest rates to date and the economic outlook”. Of course, savers have loved the higher interest returns again on their cash and term deposits, as well as making bonds more attractive too.
Nevertheless, it is likely that a future rate increase or two may still be needed in the RBA’s calculations. Lowe was clear in saying that if inflation does not return to the RBA’s target range of 2-3 per cent annualised (currently running at 6.8 per cent), then further rate increase(s) will be needed. However, a positive outlook on all this is that the RBA has positioned this target to be reached by 2025; as such, realising that it will take time for inflation to retreat. The US and European central banks have a shorter timeframe for their similar decline in inflation targets to be reached which is why their interest rates will likely move up a bit further from here, but unlikely by much though as the ‘financial stretch’ is certainly happening by now to most people and businesses alike.
With my clients, over the past few months, I am certainly noticing them wanting more drawings or even small redemptions from their investments, typically this is the case with the super/pension clients. This is the direct impact of maintaining lifestyle in these more expensive times. The longer inflation persists, the more awareness people have of their increased cash outgoings. These high prices have been absorbed for many months now, but there is a growing dent in people’s disposable incomes, whether that income is being sourced from work earnings or from retirement investment returns. People are aware, especially those with mortgages, those renters paying higher rents with the housing shortage, and other debts that people and companies have in place. Ahead, there will be/simply must be a pullback on discretionary spending. The buffer of cash reserves, and of monies in people’s offset accounts is being steadily drained to preserve their lifestyles. Economists believe this eventual spending pullback will likely be more pronounced in the travel, entertainment, and service sectors or, conversely, but with the same effect, prices will retreat to more normalised and more familiar levels.
This also implies that businesses will feel their margins squeezed and, certainty so, unless our labour market shortage eases. This labour shortage is seeing wages rise in many places; so, finding an equilibrium point in all this is confronting many businesses, particularly in the discretionary space. Although, what should help improve the tight labour situation over the next few months, is the fact that immigration is happening again, and it is in high numbers (record numbers, I believe). A very different picture to the near zero immigration of the Covid-19 of the past few years.
This should see the heat, that has been caused by these unusual last few years, taken out of the economy, and an overall slowdown result. Generally though, this really is just all part of economic cycles. Using sailing parlance, you could say that Economies jibe in and out with the tailwinds and the headwinds of life’s events on their passage through time!
Keeping with the long-term view theme for investing, I came across this informative and visual version of charts supporting the benefits of long-term investing. This information below may be of interest to you. The source and the content is adapted from a recent article by Katana Asset Management, where they quote at the start that, “The short term is unknowable, but the long term is inevitable”.
It is a bullish article for investing, and is based on historical data. Katana Asset Management describe the below as the four best charts from the past 30 years of investing.
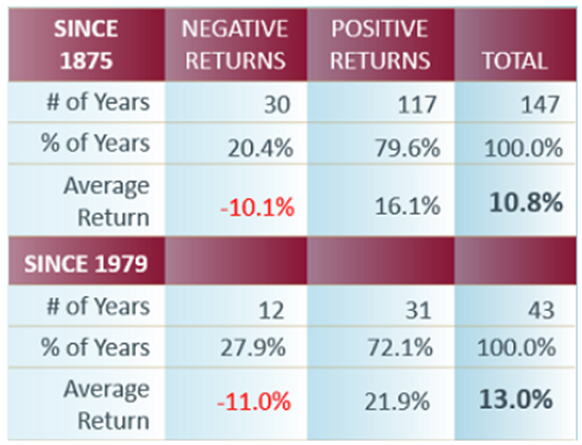
Chart 1. The long term is inevitable
Calendar year 2022 marked the 147th year of trading on Australian exchanges (under various guises). That enormous amount of data provides the clearest guide for anyone willing to learn. During this period, the market (dividends plus share prices) has risen 117 years and declined 30 years. So, 79.6% of the time, the market rises. One in five years on average, the market declines.
Source: Katana Asset Management
When the market rises, it does so by an average of 16.1%, and when it declines the average is minus 10.1%. When combined, we see that over the past 147 years, the market has averaged a return of 10.8% per annum.
Since we have become more sophisticated and introduced the Accumulation Index in 1979, the data points to an even stronger outcome. Over the 43 years since 1979, the market has risen by an average of 13.0% per annum. And this is despite some seriously scary episodes, including the 1987 stockmarket crash, the 1997 Asian Financial Crisis, the GFC, and the fastest fall on record, the recent Covid-19 pandemic.
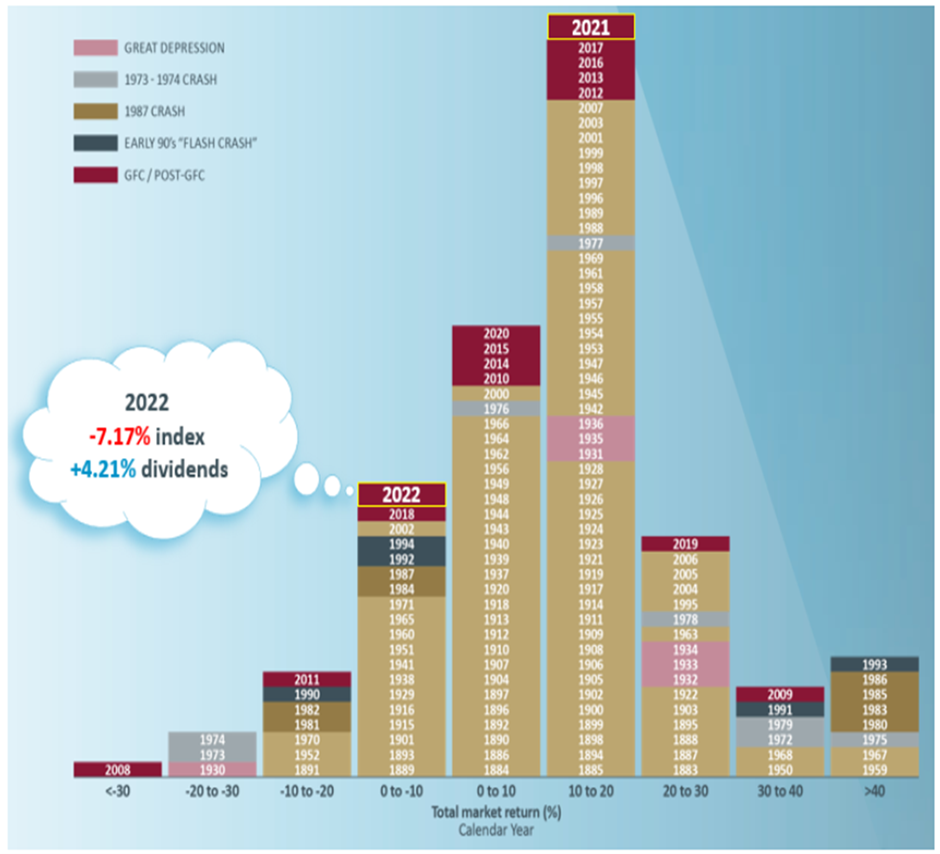
Chart 2. Volatility is the price you pay for a seat at the table
But, of course, in the short term – from year to year – markets are volatile.
The distribution curve is shown below but many investors have failed to grasp the most important aspect.
Source: Katana Asset Management
The main point is that crashes are inevitable: be ready and don’t panic at the bottom (the only time to panic is at the top).
There has only been one (calendar) year in the 147-year history where the market fell by 30% or more, in 2008. But if you panicked and sold during that crash, you would have missed an extraordinary recovery. In 2009 the market was up by 39.6% and rose in 11 of the 14 years following the crash, including by 18.8% in 2012, 19.7% in 2013 and 24% in 2019.
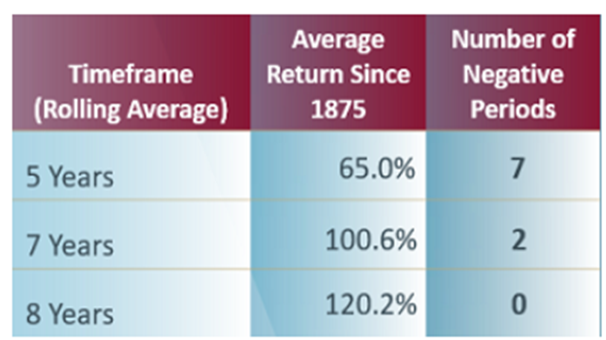
Chart 3. Rolling period returns
To better understand how the market behaves over different timeframes, we can break the data into rolling periods. For example, a rolling five-year period is the average return over every five-year period since 1875.
What this table demonstrates is extraordinary.
Source: Katana Asset Management
If you had invested your money in the index, turned off your screen, went away and came back five years later, then on average you would have a 65% return. There would have been only seven occasions out of the 143 rolling five-year periods you would have a negative return.
If you had invested your money in the index, turned off your screen, went away and came back in seven years later, then on average you would have a 100.6% return, and there would have been only two occasions where you would have a negative return.
But even more remarkably, if you had invested your money in the index, turned off your screen, went away and came back eight years later, then on average you would have a 120.2% return, and there would have been NO occasions on record where the dividends and capital growth would have been negative. There is only one long-term trend, and it is up.
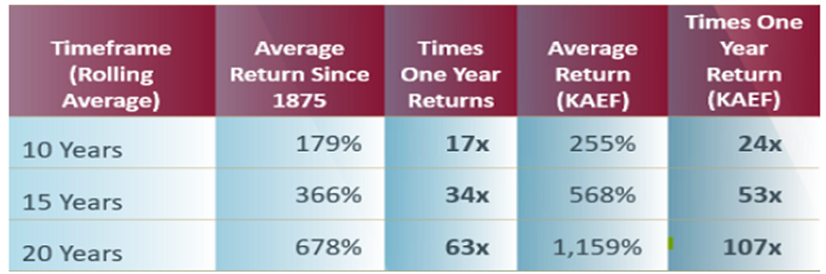
Chart 4. Wait … here’s a better table!
Source: Katana Asset Management
At Katana Asset Management, we have literally compiled hundreds of tables over the past three decades, and this is our best. We see even more dramatically, the true power of compounding. Compounding for 10 years, produces the equivalent of 17 one-year returns. Impressive. But, compounding for 20 years produces the equivalent of an extraordinary 63 one-year returns!
Timeframe, timeframe, timeframe
If the short term is unknowable and the long-term inevitable, an investor really does need to focus on the long term. If through age or financial circumstance an investor does not have the luxury of a long-term horizon, then they should understand the extra risk that they are taking on.
Remember in the stock market, volatility is the price you pay for a seat at the table. There will be another crash. Guaranteed. If your time horizon is not beyond the next crash, or you panic and do the wrong thing at the wrong time, then discretion may be the better part of valour.
(This Katana Asset Management article is general information and does not consider the circumstances of any individual. Any person considering acting on information in this article should take financial advice. Past performance is not a guarantee of future performance. Stock market returns are volatile, especially over the short term).
It is all certainly good food for thought, and is reinforcing information for us true investors!!
As always, should you have any queries please do not hesitate to contact us.
Disclaimer for information provided in this Commentary: This document, and the contents contained within, is a general communication being provided for informational purposes only. It is educational in nature and not designed to be taken as advice or a recommendation for any specific investment product, strategy, or plan feature. The views expressed in this are subject to change at any time. No forecasts are or can be guaranteed.